Improved cycling facilities in city streets increased cycling by 31 pct. TØI collected data using a mobile app recording bicycle patterns. This is the first time data collected by Apps like Strava and Google Maps Timeline are used in Norway in better estimating the utility of investments for increased bicycle use.
The primary objective was to investigate whether existing data in fact can pinpoint effects of infrastructure measures for cyclists in urban areas.

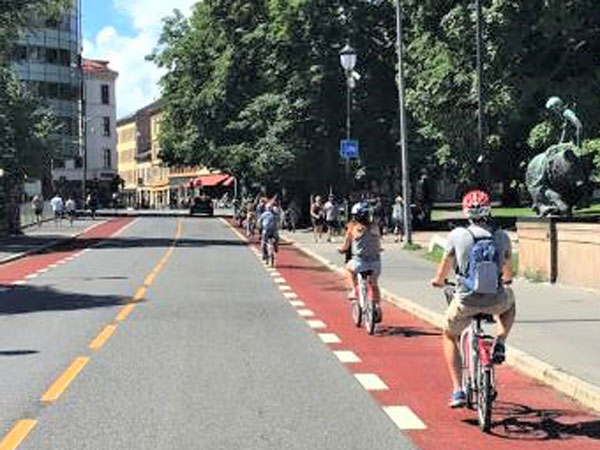
Good infrastructure increases the bicycle use. Photo: Bymiljøetaten, Oslo kommune.
New technology provides new data
Whereas traditional transportation patterns have been well documented in the national travel surveys (NTBS) since 1985, bicycling is only a minor part in these surveys. Consequently, data from NTBS are not very precise in investigating results of current bicycle measures.
App technology provides new models for recording travel patterns. Commercial participants have established both dedicated (active) training apps – such as Strava, and more “passive” versions – such as Google Maps Timeline and the discontinued Moves. These contain historical data containing knowledge about how and if the distribution of cyclists has changed from before/after measures have been installed. A total of 41 measures in Oslo, Bergen, Trondheim and Stavanger were evaluated.
More bicycling recorded
In terms of kilometers travelled by bicycle the rapport concludes a 31 pct increase, and as of the total number of bicyclists passing advanced by 19 pct. In general, the largest increase was found in areas where the most comprehensive measures were implemented. Nevertheless, the report finds so called “small measures” to also have an effect
Whether these measures result in more cycling or if previous cyclists change their routes, is not possible to establish at this point.
More information (report summary):
Analysing effects of infrastructure measures for cyclists in the cities of Oslo, Bergen, Trondheim and Stavanger using app data.
 Contact:
Aslak Fyhri
af@toi.no
Institute of Transport Economics (TØI), Norway


Follow us: