A key method in the optimisation of novel electric vehicle systems are simulations. Simulations provide important information that can be utilised to plan an optimised system with reduced total costs and harmful emissions, or optimise the operation of a system with digital-twin solutions. However, thorough validation is a necessity for a useful simulation tool. A recent study assessed the capability of VTT Smart eFleet simulation tool to depict realistic electric city bus operations.
Over the last few years, VTT Technical Research Centre of Finland has been developing a simulation tool known as “VTT Smart eFleet”. VTT Smart eFleet is a system-level simulation environment capable of modelling various vehicle fleet operations. It is developed with modularity in mind, the tool enables the possibility of various use cases to be applied, from underground mining to city bus operations, from system planning to operation-based digital-twin applications.
VTT Smart eFleet was validated for electric city bus operations in two phases. In the first phase, the vehicle dynamics model was validated, while in the second phase, fleet simulation method validation followed.
Simulated and measured data matched in the vehicle dynamics validation
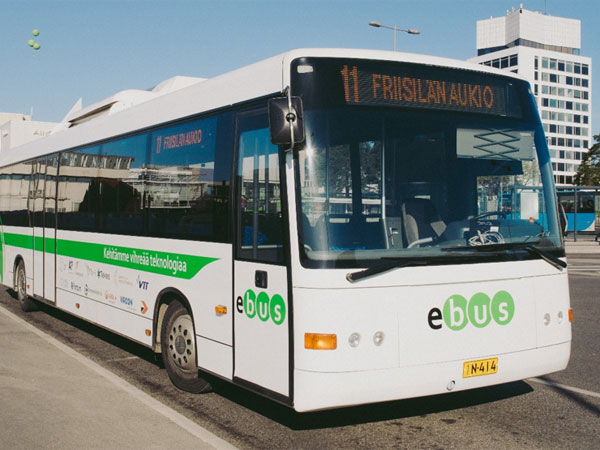
The vehicle dynamics validation consisted of comparisons between measured data and simulated results. The simulated vehicle model was based on an independent electric bus prototype (Fig. 1.), originally developed in the eBus project and currently owned by VTT. The vehicle was measured at VTT’s heavy-duty automotive dynamometer to provide inputs for the vehicle dynamics model and data for the powertrain validation.

Fig. 1. Electric city bus prototype of VTT, which serves as a test platform for various electromobility related services and components.
Photo: VTT
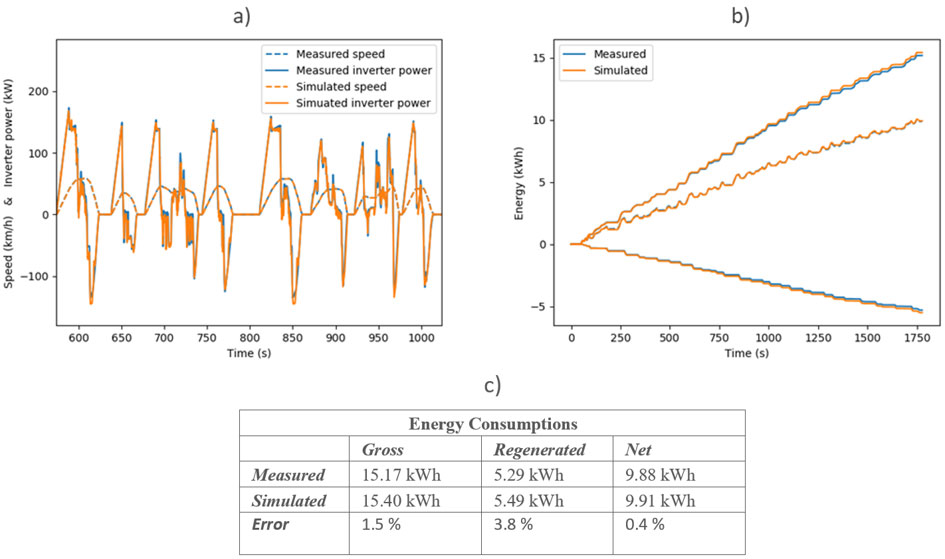
In the validation analysis, overall energy consumption, transient power usage of the powertrain and actualised speed profiles were compared. This approach ensures that the dynamics model is capable of replicating accurately the transient energy flows of real vehicles. The validation results presented in Fig. 2. indicate that the simulated data is in close agreement with the measurements, as the transient speed and inverter power values were matching (Fig. 2. a). Respectively, the relative error between measured and simulated net energy consumptions was 0.4 %, while simulated gross energy consumption was 1.5 % higher and regenerated energy 3.8% higher.

Fig. 2. a) Comparison of simulated and measured speed and inverter power and b) comparison of simulated and measured inverter energy consumptions.
Probability density functions successfully described the bus system operation
In the validation of system operation, the focus was on the scheduling of the bus operation. The actualised schedule of a bus is affected by multiple different factors. For instance, traffic conditions, stopping frequencies and stopping times, which all define the duration it takes to finish a run. In the simulation of opportunity charged electric bus systems – where the bus is charged during the operation, typically at the end stops – realistic operation schedule is just as important as simulating with valid vehicle models. As the buses follow a fixed vehicle-specific schedule, the run duration determines the time available for charging. Thus, for valid system-level analysis, the simulation tool has to be able to model the bus operation correctly.
Probability density functions for each hour of the day were formed based on the measured travel data. For instance, the bus would sample from different probability density functions at 6 am and 7 am in the simulations. This way, the bus was more likely to have higher stopping times and frequencies during rush hour time, and as a result, operation was in close correspondence with measured travel times.
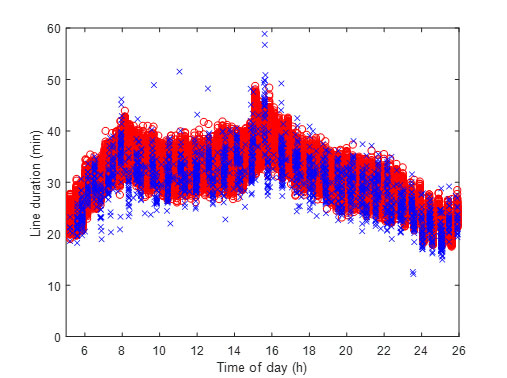
The bus system simulation method was validated by comparing simulated travel times to real life measurements on Helsinki bus line 23. Fifty weekdays of operation were recorded, likewise, the whole day simulation was repeated fifty times to unfold changes in operation between the different days. The travel times for both, simulated and measured runs are presented in Fig. 3 that indicates close resemblance between the simulations and measurements. As expected, fastest runs were witnessed during early morning and late evening when the traffic volume and passenger amount are low. Contrarily, longest travel times are seen at around 4 pm. There is also a peak in the travel time during the morning rush hour. The utilisation of probability density functions to sample stopping frequencies and times proved to be effective method to describe the operation of an electric bus system.

Fig. 3. Driving time durations in line 23 over the day. Blue crosses depict measured runs, while red circles mark simulated runs.
Conclusions
The study demonstrated the potential of statistical utilisation of real-life operational data in simulations to describe electric bus operations in high detail, both in vehicle model and system-level domain. The simulation method utilised in VTT Smart eFleet proved to be capable of producing realistic and dependable results that can be further utilised in vehicle system analyses. For instance, the tool has been used to perform techno-economic studies on electric city bus systems, with focus on system feasibility and total cost of ownership. In practice, the analyses entail simulations to find out optimal battery specifications and investigate charging requirements. The outcomes can be used in the planning phase to optimise the systems, e.g. by preventing component over-sizing while still ensuring reliable operation, and thus reducing up-front costs and emissions.
Report:
Joel Anttila, Yancho Todorov, Mikaela Ranta, Mikko Pihlatie (2019):
System-Level Validation of an Electric Bus Fleet Simulator.
IEEE Vehicle Power And Propulsion Conference (VPPC) 2019
 Contact:
Joel Anttila
joel.anttila@vtt.fi
VTT Technical Research Centre of Finland, Finland


Follow us: