The demand for comprehensive data on delays and travel times within the Reykjavík Metropolitan Area has surged. This rise in demand is particularly pertinent given the numerous construction projects slated for the region under the auspices of the Transport Treaty (is. Samgöngusáttmáli). Accurate information on travel times, both pre- and post-construction, is critical for evaluating the effectiveness and progress of these initiatives. This project introduces and assesses a novel methodology for measuring travel times and estimating delays by leveraging Google Maps as a data source.
By evaluating and analyzing the locations of major delays, the collected data can inform proposals for improvements and project prioritization. Subsequent measurements of travel times post-improvement allow for the estimation of benefits and the assessment of the impact of construction on travel times.
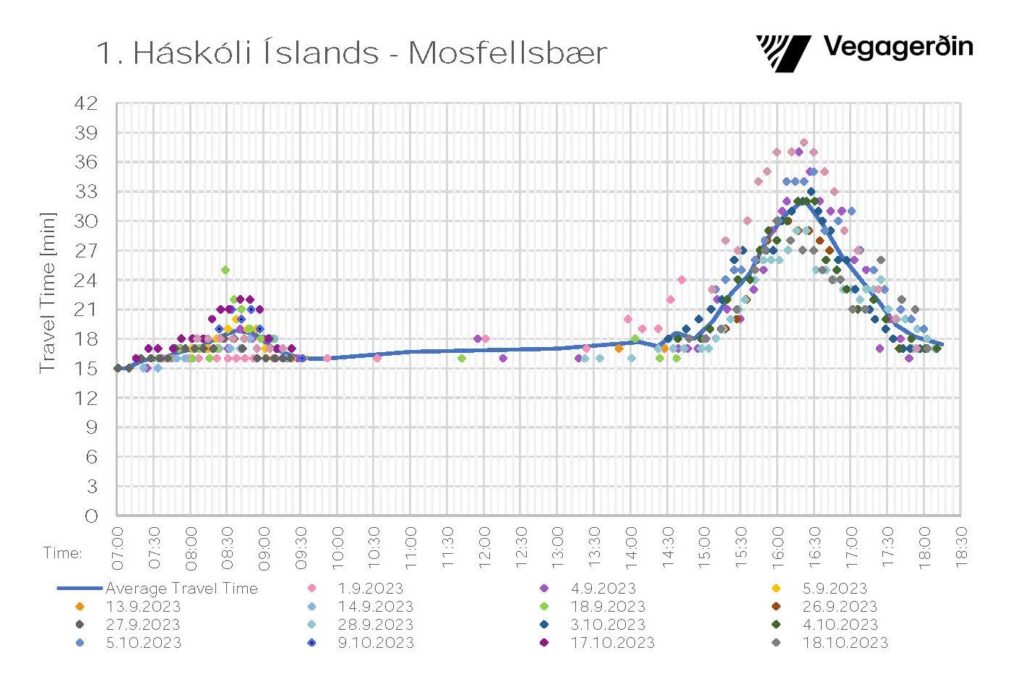
In a novel research project, travel times in the Metropolitan Area were measured using Google Maps, a web service that provides geographical information including travel times and route choices. Specific starting points and destinations were selected, and both the starting times and estimated travel times were recorded (see Figure 1 for an example). This methodology was applied to measure travel times on 20 longer routes and 20 shorter routes within the Metropolitan Area, focusing on road sections known for delays. Approximately five measurements were taken in the early morning, five outside peak traffic hours, and five in the afternoon. This project was funded by the Icelandic Road and Coastal Administration Research Fund (Grant no. 1800-951).
The research project in the Metropolitan Area of Iceland had three primary objectives:
- Measure travel times for various routes and estimate delays during peak hours.
- Define peak traffic hours in the early morning (AM) and afternoon (PM).
- Compare travel times across different years.
Definition of Traffic Peak Hours in the Metropolitan Area of Reykjavík
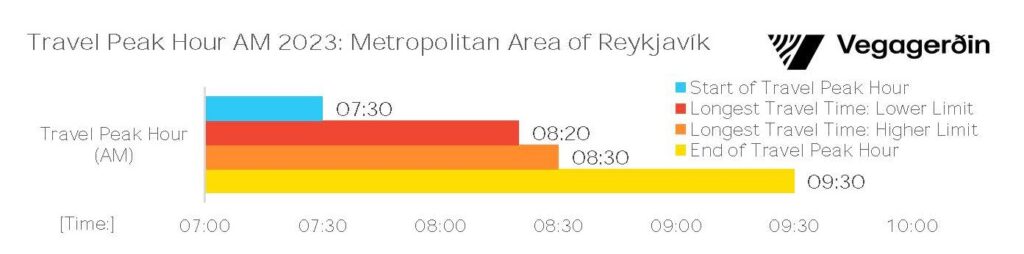
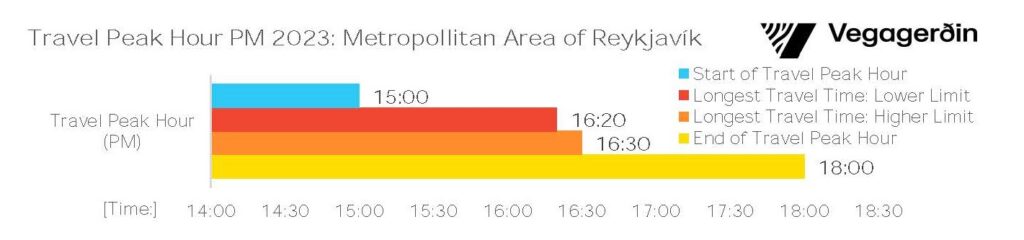
Traffic peak hours are characterized by travel times exceeding those of free-flow conditions. Both inbound routes from the suburbs to the city center and outbound routes from the city center to the suburbs were examined. Typically, the early morning peak hour from the suburbs to the city center begins at 7:30, with the longest travel times occurring between 8:20-8:30 and ends at 9:30 (see Figure 2). In the afternoon, peak hour generally starts at 15:00, with the longest travel times occurring between 16:20-16:30 and ends at 18:00 (see Figure 3).
Travel Time in the Metropolitan Area of Reykjavík
The average speed on longer routes from the suburbs to the city center in the morning was 28.6 km/h, while the average speed from the city center to the suburbs was 42.3 km/h. In the afternoon, the average speed on longer routes from the city center to the suburbs was 25.2 km/h, and from the suburbs to the city center, it was 38.7 km/h. Outside of travel peak hours, the average speed on longer routes was 46.4 km/h. During peak of travel peak hours, travel times increased by approximately 62% in the morning from the suburbs to the city center and by 84% in the afternoon from the city center to the suburbs.
On shorter routes, the average speed in the morning from the suburbs to the city center was 20.7 km/h, and from the city center to the suburbs, it was 31.7 km/h. In the afternoon, the average speed from the city center to the suburbs was 20.7 km/h, and from the suburbs to the city center, it was 30.6 km/h. The average speed on shorter routes was approximately 36.5 km/h outside of travel peak hours. During peak of travel peak hours, travel times increased by about 76% on shorter routes in both the morning and afternoon compared to normal travel times.
Comparison of Travel Times in the Metropolitan Area of Reykjavík Between Years
Travel time measurements using Google Maps were conducted for the years 2021 and 2022, although fewer measurements were taken for each route in those years. The longest recorded travel times were used for comparison, differing from the method in 2023, which calculated the average of the longest and shortest travel times during peak hours (see Figure 4). The City of Reykjavík conducted travel time measurements in 2012, 2015, and 2018 on routes within Reykjavík, and these routes were also measured in 2023 using Google Maps in this project
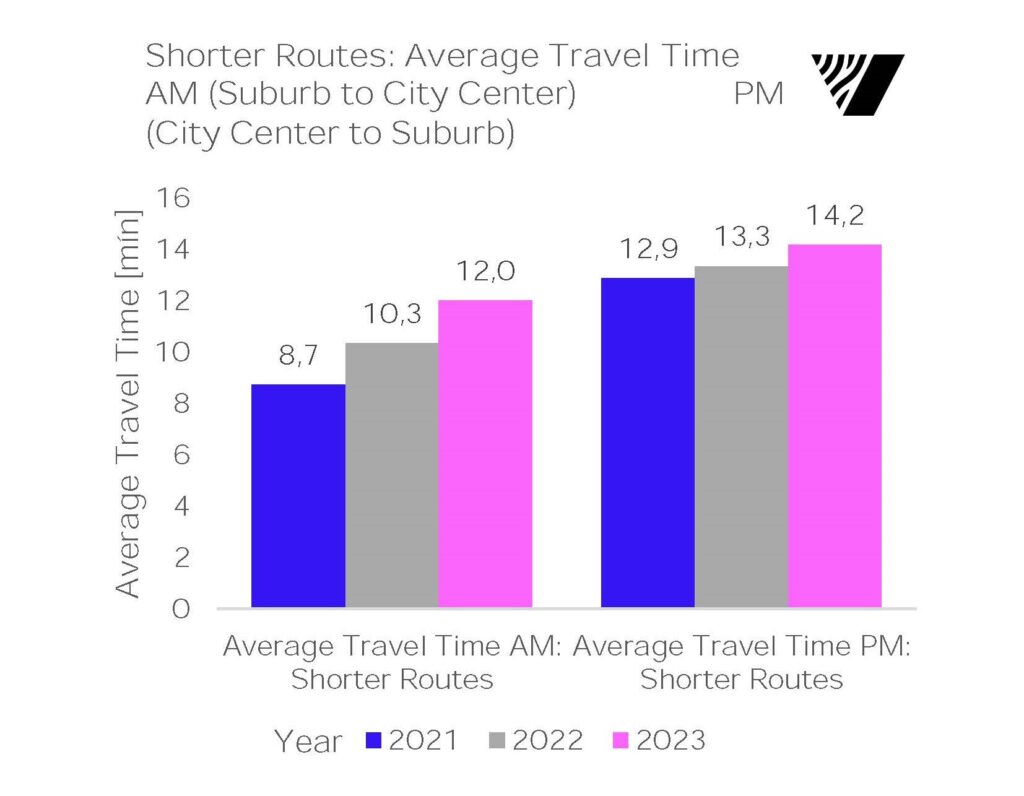
Figure 4 compares total travel times in the morning from the suburbs to the city center and in the afternoon from the city center to the suburbs for longer routes over different years. Figure 5 summarizes the average travel times for shorter routes over different years. On longer routes, travel times increased by 26% in the morning and 19% in the afternoon from 2021 to 2022 but showed little change between 2022 and 2023. On shorter routes, travel times increased by 38% in the morning and 10% in the afternoon from 2021 to 2023. In Reykjavík, travel times increased slightly, by 3-4% in the morning and 8-28% in the afternoon between measurements. From 2018 to 2023, afternoon travel times in Reykjavík increased by 28%, from 127.2 minutes in 2018 to 163.5 minutes in 2023. Differences in measurement methods should be noted.
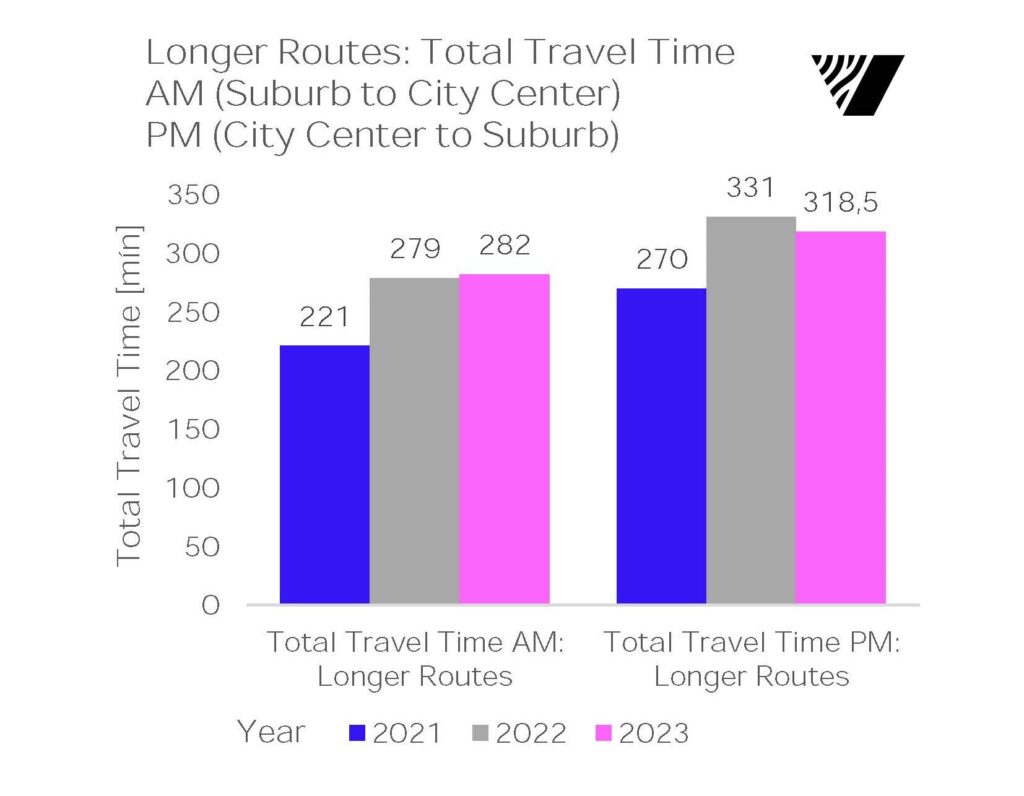
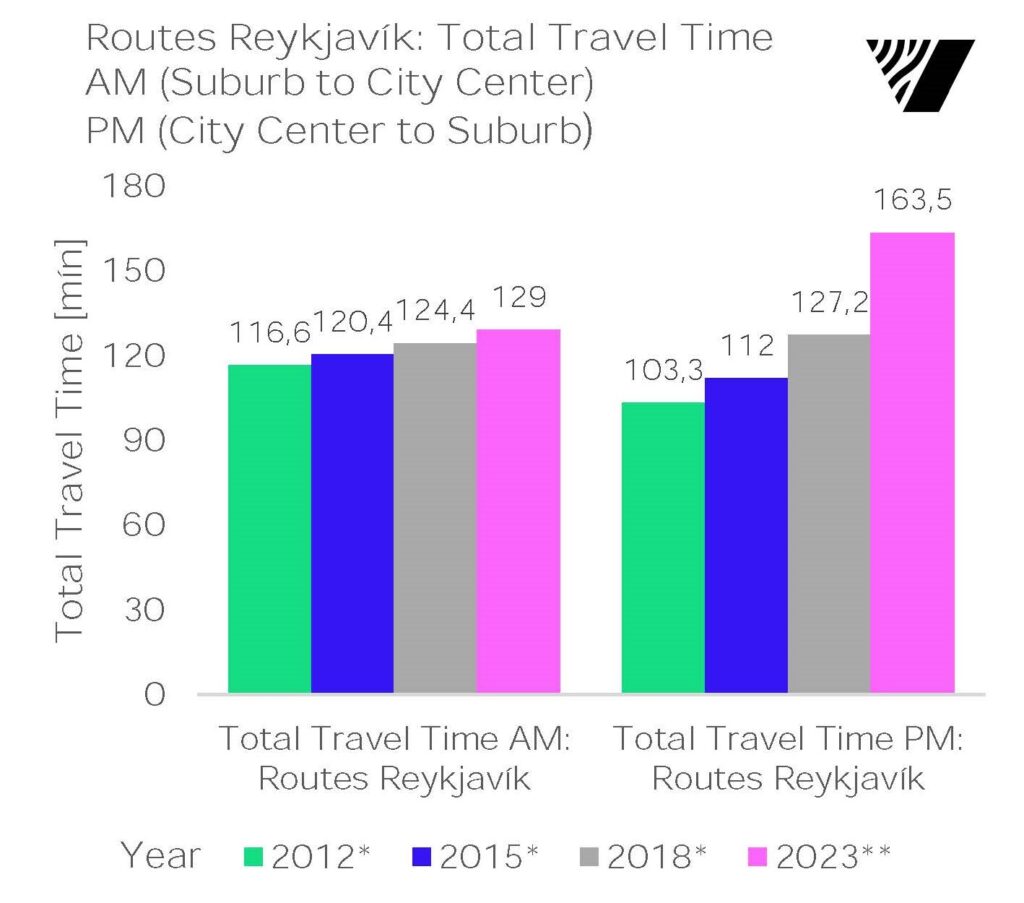
Figure 4 Summary of total travel time for longer routes and routes in Reykjavík. The travel time includes the sum of all measured routes, from the suburb to the city center in the morning (AM), and from the city center to the suburb in the afternoon (PM). *Measurements made by driving, total travel time when leaving at 07:55 in the morning and at 16:45 in the afternoon. ** Measurements with Google Maps.
Using Google Maps to Measure Travel Times and Estimate Delays
Employing Google Maps to measure travel times, estimate delays, and define peak traffic hours offers an efficient and cost-effective approach to analyzing traffic across various routes. Traditional methods, such as physically driving the routes, are time-consuming and yield fewer measurements. Alternative tools, such as TomTom, which provides traffic information including travel times and delays averaged over specific periods, could also be considered. The data collected in this research will serve as valuable historical information and will be instrumental in future assessments, both during and after the completion of improvement projects under the Transport Treaty.
Contact

Sigríður Lilja Skúladóttir
sigridur.lilja.skuladottir@vegagerdin.is
Icelandic Road and Coastal Administration, Vegagerðin


Follow us: