
VTT has investigated the potential of relatively small, exploratory, dynamic models to produce insight for policy-making to facilitate at modal shifts towards carbon free urban transport. Further, the key elements that build such a model have been identified.
To offer citizens alternative modal choices, transport system actors need knowledge on the potential impacts of modal shifts for the basis of their decisions. However, gaining such knowledge is challenging, as the transport system is a complex, socio-technical entity featuring multiple types and levels of actors. Impacts of new modal choices may occur through a multitude of paths, interlinkages and combined influences of activities and actors.
System dynamic (SD) models are appropriate tools for understanding complex societal transitions since they can consider the co-influence of variables over time (Holtz et al. 2015). However, treatment of uncertainties is surprisingly undeveloped in transitions modelling, even though uncertainty is a foundational topic area of transitions research and parameters that govern large-scale social change are typically unknown (Papachristos 2019). Our work responds to the parametric uncertainty in modal choices with an exploratory modelling approach, meaning that we have investigated the variance and distribution of possible outcomes when only broad assumptions of unknown values are made. We executed exploratory system dynamics with a relatively compact model. This is because small dynamic models can be particularly effective when communicating with policymakers (Ghaffarzadegan et al. 2010) or other stakeholders.
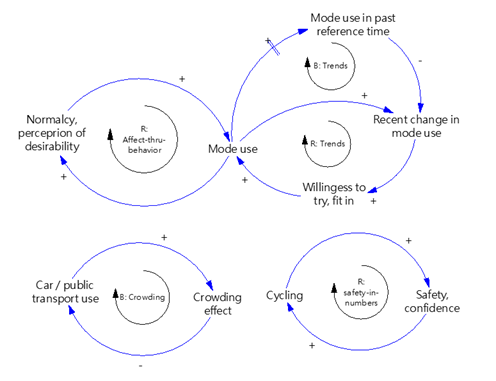
Feedback loops
The selection of feedback loops can have a dramatic effect on the results of system dynamics models. We postulate in our model the loops presented in Figure 1. The loops are primarily intended as a demonstration of the feedback principles. The loops are: Crowding (balancing loop), Safety-in-numbers (reinforcing loop); Trends (reinforcing and balancing loops); and Affect (reinforcing loop).
Model structure
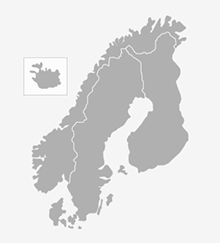
Change in mode choice is modelled per trip and as the aggregate across all trips. Trips are divided into commutes, errands and leisure trips. Although broad, this categorization is specific enough to test for instance commute-specific actions like teleworking or rush hour road tolls. Each trip type may be taken by car, public transport or active travel. Again, the broad categories effectively represent no, low and large emissions despite variance within particularly different types of cars. Overall, mode choice is modelled as a 3×3 grid of purpose-mode combinations. The empirical data used in the model concerns mainly the number of trips and feasibility limits of modes. The data are from the Helsinki Region (2018) and the National Transport Surveys (2016) and LIPASTO emissions database. Unknown variables include all impact weights – i.e. by how much choices change per given action such as price changes.
Demonstration of the model dynamics
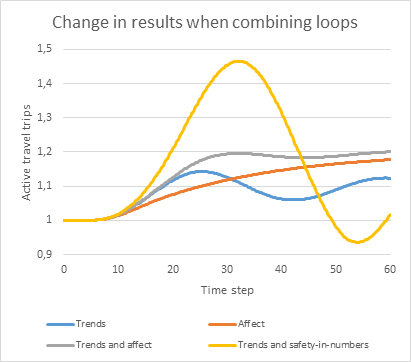
Figure 2 demonstrates how alternative combinations of feedbacks can lead to dramatically different outcomes. All four curves in the figure feature the same intervention to make active travel easier. For the blue curve, only trend effects apply and the outcome is oscillation. For the red curve, the affect loop is activated, leading to a stable increase in the attractiveness of active travel. Initial growth is slower versus the blue curve. For the green curve, both loops are activated at once. The figure shows that the trend and affect effects support one another: trends build up the mass of behavioural change, generating affect, while increasing affect maintains the growth of active travel so as mitigating the downward cycle of the trend oscillation effect. Growth is faster than for the red curve and a higher level of active travel is achieved at all times compared to the blue curve. Conversely, some feedback loops can lead to adverse outcomes. The yellow curve illustrates how certain assumptions of change processes in fact imply quite strange and unwanted dynamics.
The demonstration shows that it matters a great deal which kinds of dynamics we assume to be triggered when we develop the transport system. Alternatively, decision-makers can try to actively create conditions for reinforcing and synergistic feedbacks – leading to speedy and large-scale change. For instance, if information on the positive experiences of new cyclists is provided, increased cycling can encourage further cycling through reinforcing feedback.
Conclusions
Our work explored alternative theories of change in the context of modal choice. The demonstrations of combining structural analysis with an exploratory modelling approach showed the following potential use cases:
- Highlighting which variables or parameters appear to be most responsible for the uncertainty range
- Establishing that outcomes of interventions improve / do not necessarily improve under all possible parameters
- Establishing that a given system structure implies superiority of certain (combinations of) interventions under all possible parameters.
The central element that allowed making specific claims about parametrically uncertain models was their feedback structures, as alternative combinations of feedbacks directed results in very different trajectories.
In more practical terms, our work provides an example of the kind of support a small and flexible model can offer, for instance to city level decision-makers before major effort is expended on validating details of the case. We look forward to applying this groundwork for specific cases and alternative local data. The modelling approach is flexible to suit alternative transport contexts, policy concerns and impact assessment needs.
Further information
Wiman, H., Tuominen, A., Mesimäki, J., Penttinen, M., Innamaa S. & Ylén, P. Assessing the role of modal choices towards carbon free urban transport in Helsinki, Finland – An exploratory modelling approach. European Transport Conference 2021. (forthcoming in conference proceedings).
References
Ghaffarzadegan, N., Lyneis, J. and Richardson, G.P. (2011). How small system dynamics models can help the public policy process. Syst. Dyn. Rev., 27: 22-44. https://doi.org/10.1002/sdr.442
Holz, G. (2011). Modelling transitions: An appraisal of experiences and suggestions for research. environmental Innovation and Societal Transitions 1 (2), 167–186.
Papachristos, G. (2019). System dynamics modelling and simulation for sociotechnical transitions research, Environmental Innovation and Societal Transitions, Volume 31, 2019, Pages 248-261, ISSN 2210-4224, https://doi.org/10.1016/j.eist.2018.10.001
Text: Henri Wiman, Anu Tuominen, Johannes Mesimäki & Merja Penttinen, VTT.
Contacts:

Henri Wiman
henri.wiman@vtt.fi
VTT Technical Research Centre of Finland Ltd., Finland

Anu Tuominen
anu.tuominen@vtt.fi
VTT Technical Research Centre of Finland Ltd., Finland

Johannes Mesimäki
johannes.mesimaki@vtt.fi
VTT Technical Research Centre of Finland, Ltd., Finland


Follow us: