
The European Baseline project aimed to develop and harmonise the methodology for collecting a set of key performance indicators concerning traffic safety in Europe. Finland was one of the 19 EU member states involved in the project.
As part of the project, Finland collected and reported the results of six out of eight possible road traffic safety indicators. The Finnish work was carried out by VTT Technical Research Centre of Finland and the Transport and Communications Agency. This article presents Finnish results from the alcohol, distraction and post-crash care KPIs. These KPIs are defined as:
- Percentage of drivers driving within the legal limit for blood alcohol content (BAC) (KPI Alcohol)
- Percentage of drivers NOT using a handheld mobile device (KPI Distraction)
- Time elapsed in minutes and second between the emergency call following a collision resulting in personal injury and the arrival at the scene of the collision of the emergency services to the 95th percentile (KPI Post-Crash Care)
The Alcohol KPI was estimated with data from a public survey directed to those who drive a car at least once per month (n = 1,322). The survey was based on the E-Survey of Road user’s Attitudes (ESRA) questionnaire and asked respondents whether they had, in the previous 30 days, 1) driven under the influence of alcohol in general, and 2) driven under the influence of alcohol and suspected their BAC to have exceeded the legal limit. According to the results, 10.4% responded having driven under the influence of alcohol in general and 3.9% of respondents reported having driven while their BAC may have exceeded the legal limit in the previous 30 days. The survey also asked respondents whether they had travelled by motorbike, bicycle or e-scooter after drinking alcohol. Of respondents who had driven a motorcycle at least several times in the past year (n = 206), 3.9% had driven a motorcycle and suspected being over the legal BAC limit in the previous 12 months. The respective figures for cyclists (n = 985) and e-scooter riders (n = 135) are 27.7% and 40.7%, indicating large variation between modes.
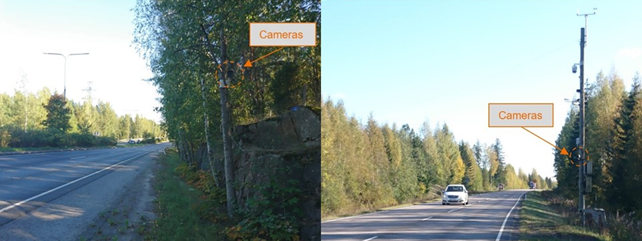
For the distraction KPI, drivers were photographed with automated cameras at various locations on motorways, highways and on the urban street network (see image below). Upon the detection of a licence plate on an oncoming vehicle, the camera system took a photograph of the vehicle and driver. Locations were selected with exposure-weighted sampling and directed close to automated traffic measurement stations. A total of 30 measurement points were selected in a geographically representative manner. The photographs were analysed with a specialised tool, allowing the researchers to efficiently determine whether the pictured driver was using a handheld device or not. After weighting the results based on traffic data from the automatic measurement stations and conducting an interrater reliability check, the final result indicates that 98.0% of drivers do not use a handheld device while driving.
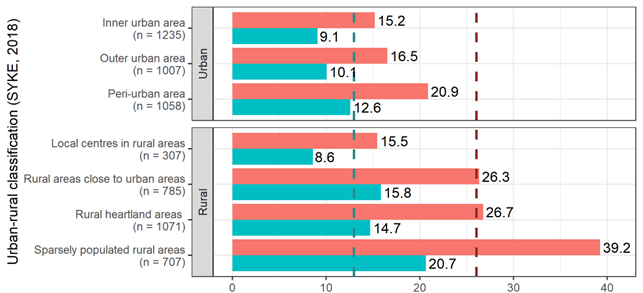
The post-crash care KPI was estimated based on the resource and accident statistics database of the Finnish rescue services, known as PRONTO. For road traffic accidents resulting in personal injury, the database contains information on the time of the emergency call, time of rescue unit departure and arrival, an estimate of casualties, road type and geographic coordinates. For road traffic accidents, the 95th percentile of the times between emergency calls and the arrival of the first rescue unit to arrive was 26 minutes and 1 second, with a mean of 12 minutes and 59 seconds. The figure varies substantially by location, with shorter times in more urbanised areas and longer times in more rural areas (see figure below). In addition, the indicator varied by road type, with the shortest response times on motorways and the longest on rural highways.
Altogether, the results from the project provide an improved image of traffic safety in Finland from a variety of perspectives. More results concerning the above KPIs and others are available in Finnish in the following report:
Silla, A., Mesimäki, J., Peltola, H., Itkonen, H., Lehtonen, J. & Rajamäki, R. 2022. Tieliikenneturvallisuusindikaattoritietojen kerääminen – Baseline-tutkimushanke.

Johannes Mesimäki
johannes.mesimaki@vtt.fi
VTT Technical Research Centre of Finland, Ltd.
Finland


Follow us: