
Nordic Road Authorities join efforts for better decision making in road winter service. A new model for predicting residual salt on the road enables a more precise and economic salt spreading without compromising traffic safety and road network accessibility.
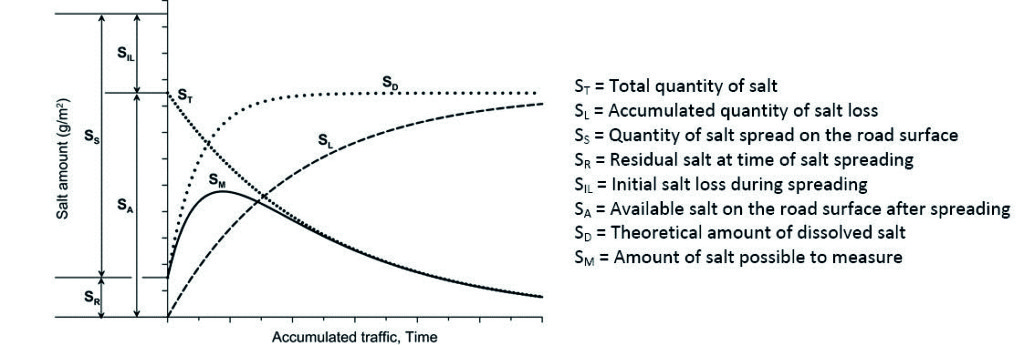
Figure 1, The MORS model approach (Illustration: MORS project group)
Introduction
In an effort towards a more economic and effective use of salt in winter maintenance, a joint research and development project, MORS (Modelling Residual Salt), was initiated under the NordFoU framework during 2011-2013, the common platform of the Nordic road administrations for research collaboration. The funding partners are the road administrations of Denmark, Sweden, Norway and Iceland. The aim of the project is to develop a model to be implemented within present and future decision support systems for daily winter service management.
Model background
The model will be predicting the residual salt development on the road, taking traffic, road and weather parameters into consideration (Figure 1). The model development is supported by intensive field measurements on the Bygholm test facilities in Horsens, Denmark, where the model parameters can be extensively studied and to a large degree controlled. The test facilities enables detailed measurements of residual salt on the pavement surface under controlled conditions, both with manual measurements and by automatic road sensors. In 2012, several intensive measurement campaigns were conducted in order to monitor the different processes contributing to salt and water leaving the road surface. Processes included in the model are run-off, blow-off (solid salt), spray-off (liquid splash and spray), evaporation, condensation, precipitation, and salt spreading.
Bygholm test facility
The test site consists of an approximately 650 m long two-lane road with a turnaround at each end, enabling circular traffic to simulate traffic passing through the measurement section halfway down the track (Figure 2). Permanently mounted equipment includes a traffic counter, road surface sensors for salt amount, salt concentration, temperature and water amount, an automated weather station and an optic sensor for road conditions. Manual measurement methods applied include salt amount by SOBO20 device and the Wet Dust Sampler, salt concentration by optical refractometer, water amount with the Wettex-method, trays on the road edge to collect run-off, and petri-dishes to collect redistributed droplets within and in the vicinity of the road (Figure 3). Liquid water on the road surface during experiments is either achieved by natural precipitation or through spreading. The measurements resulted in knowledge giving a better understanding of the residual salt development, and enables validation of automated sensors for real traffic situations.
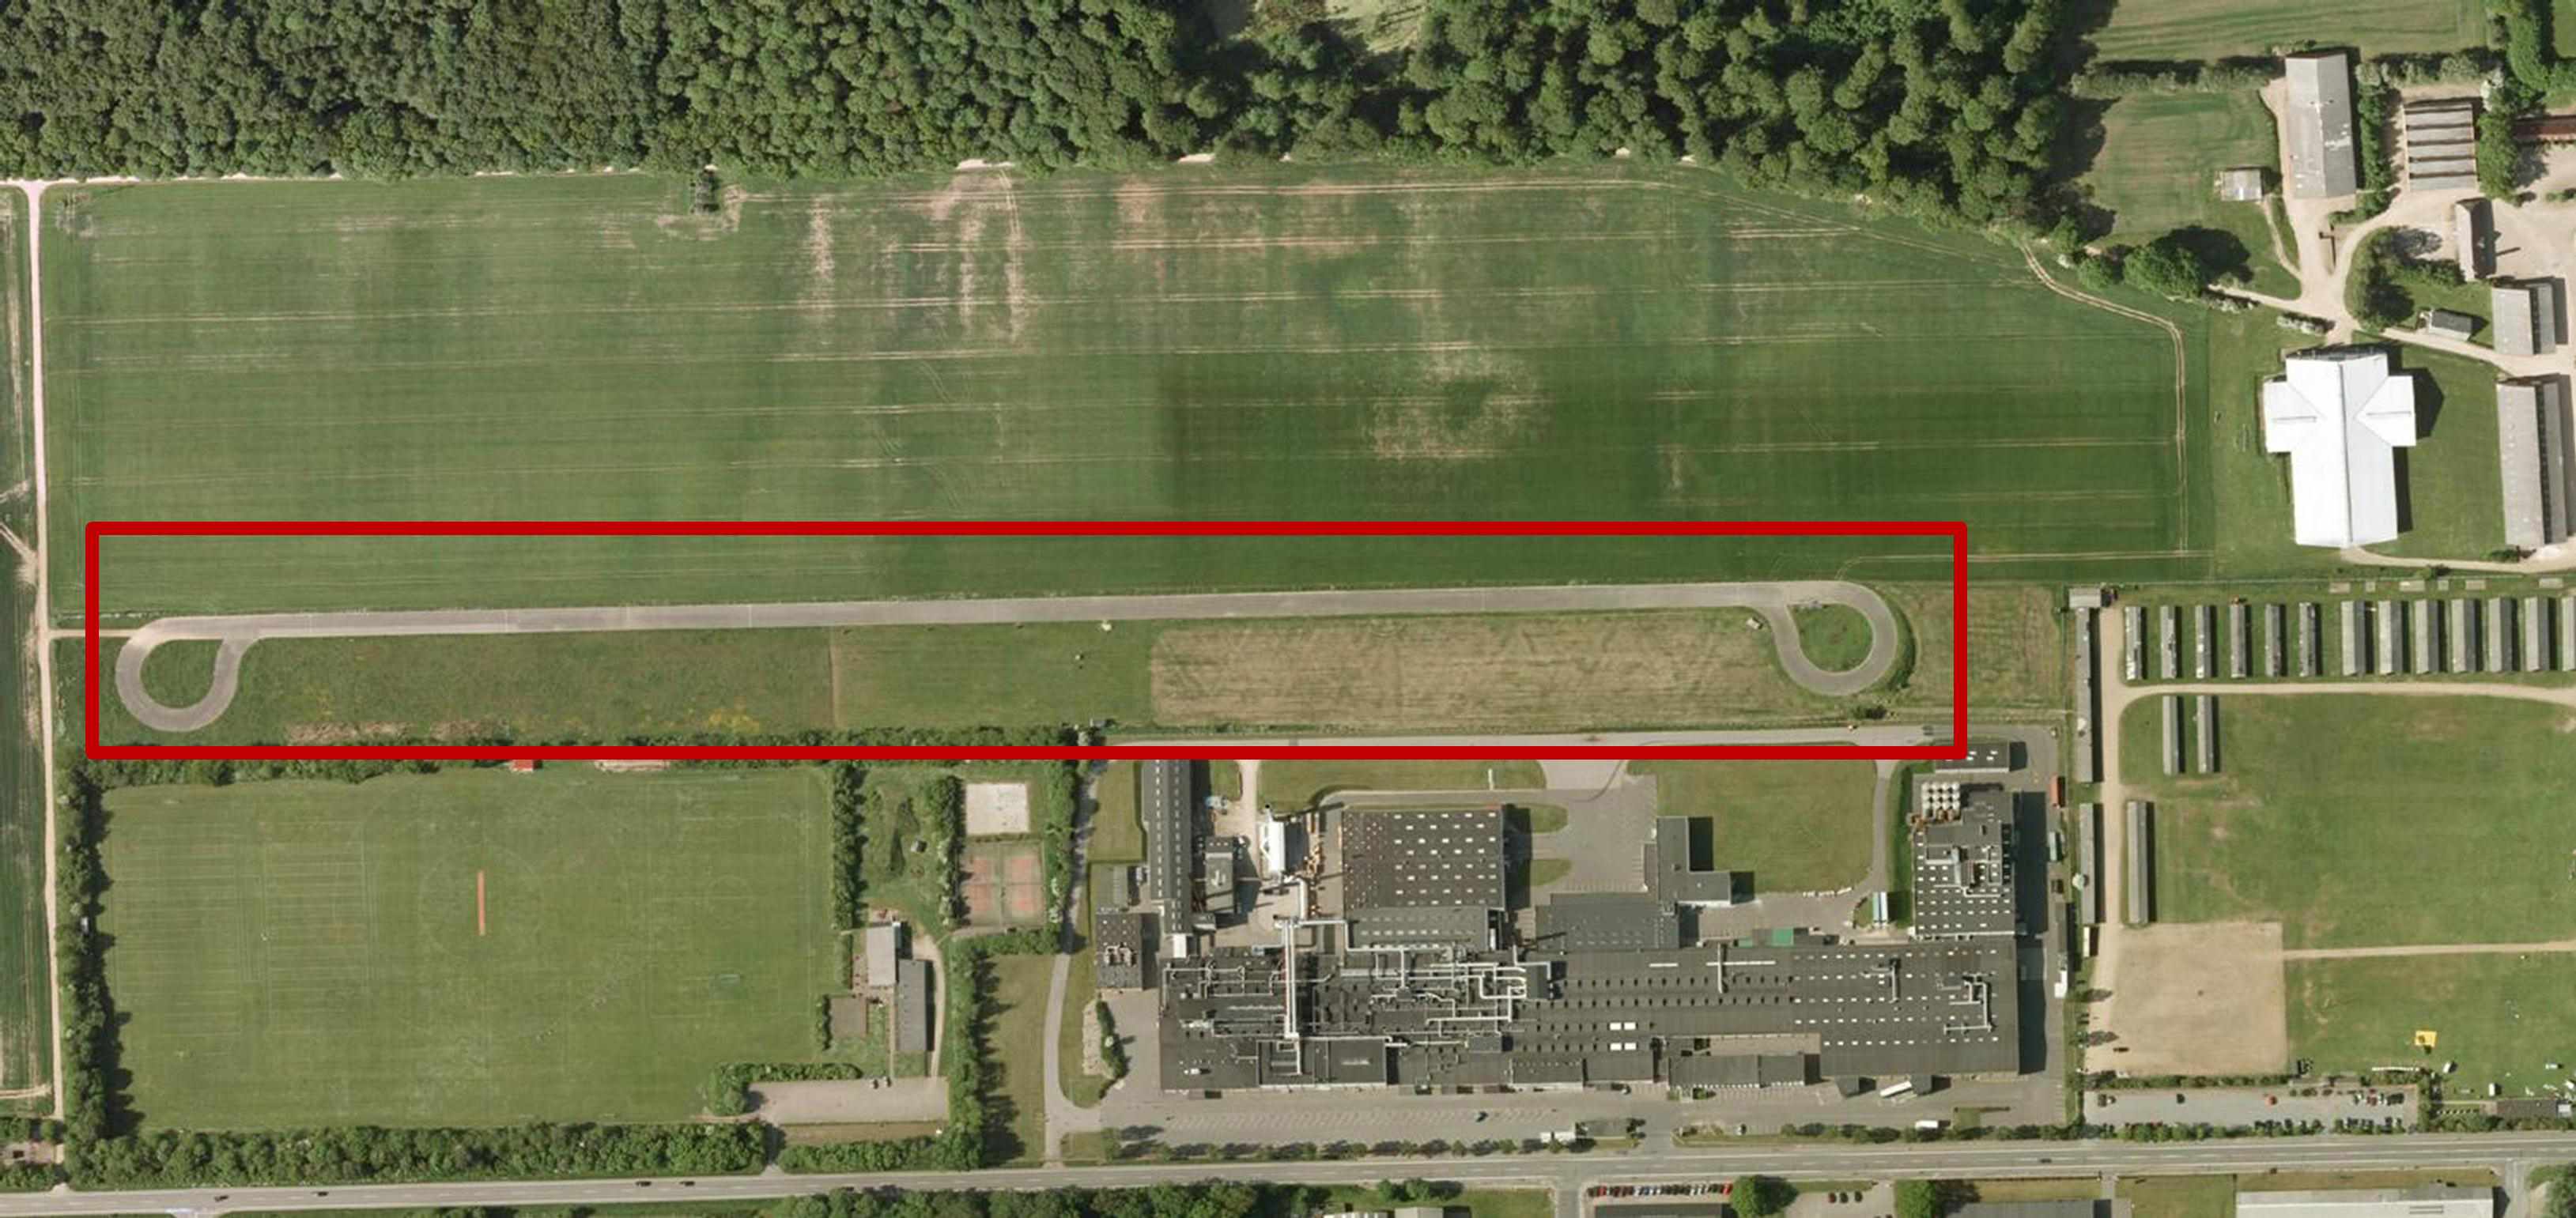
Figure 2. The Bygholm test facility (Source: Google maps)
Model validation
In order to validate the model and calibrate it to different road and traffic classes, it will be implemented and monitored in a number of road sections with different pavement characteristics, local conditions and speed limits during the winter of 2012/13.
Application and future development
Implementation of the model will be made possible in a range of different complexity levels from including comprehensive algorithms into existing advanced decision support systems, in the one end, to the use of simple printed graphical nomograms, describing the same processes, at the other end. With aid from the model, decision makers have a better possibility of assessing the current and required salt amount on the road surface and planning future operations. It is expected that the model may contribute to a more precise and sound use of salt application rate, without compromising traffic safety and road network accessibility. Future development opportunities of the model include refined physical interpretation of the individual processes, input from automatic sensors, both in-vehicle mobile sensors and mounted on-site and direct input from weather forecast and observation systems.

Figure 3. Example of manual measurements at the Bygholm test site (Photo: Göran Blomqvist & Mats Gustafsson)

Figure 3. Example of manual measurements at the Bygholm test site (Photo: Göran Blomqvist & Mats Gustafsson)

Figure 3. Example of manual measurements at the Bygholm test site (Photo: Göran Blomqvist & Mats Gustafsson)
More information can be found att NordFoU’s website.
 Contact: Contact:Michel M. Eram me5@vd.dk The Danish Road Directorate |


Follow us: